Radar tracks precipitation echoes, while satellites measure reflected and emitted radiation across broad areas. Check the timestamp first, because a smooth animation can combine observed frames with a short-term projection.
What Radar and Satellite Images Show
Radar and satellite images observe different parts of the weather. Weather radar detects energy returned by precipitation and other targets in the atmosphere. Satellite sensors measure radiation reflected or emitted by clouds, the atmosphere and the surface.
That difference matters when you read a weather map. Radar usually gives the more direct view of precipitation echoes, but it samples the atmosphere above the surface. Gauges and local observations confirm what reaches the ground. Satellite imagery gives the wider view: cloud systems, moisture patterns, fog, smoke and the development of storms across large areas.
Both are observations, not forecasts. They show conditions at or shortly before the time marked on the image. Some apps extend a radar animation into the future, but those later frames are a short-term projection rather than new observations.
How Weather Radar Works
A weather radar sends short pulses of microwave energy through the atmosphere. When a pulse meets raindrops, snowflakes, hailstones or another target, a small part of the energy returns to the antenna. The time taken to return gives the distance, while the antenna’s direction gives the target’s position.
The strength of the return is called reflectivity and is usually expressed in dBZ. Larger particles and a greater concentration of particles generally produce a stronger return. A map translates the measurements into colours so that light and heavy precipitation are easier to distinguish.
Reflectivity does not measure rainfall at the ground directly. The radar samples a volume of air above the surface, then software estimates what the return means. The same reflectivity can represent different precipitation rates depending on whether the radar is seeing rain, wet snow, dry snow or hail. Always use the legend supplied with the map instead of assuming that a particular colour has the same meaning in every app.
Read Precipitation Explained for the differences between rain, snow, sleet, freezing rain and hail.
What Doppler and Dual-Polarization Radar Add
Doppler radar measures how targets move towards or away from the antenna. It does this from the small change in the returned signal caused by motion. Meteorologists use radial velocity to study wind patterns within storms, including areas where winds rapidly change direction or speed.
Velocity is not the same as the wind speed at your location. Radar only measures the component of motion along the beam. A target moving across the beam can have a low radial velocity even when it is moving quickly.
Dual-polarization radar transmits and receives energy in horizontal and vertical orientations. Comparing the two returns provides information about particle shape, size and uniformity. This helps distinguish rain, snow and hail, improves precipitation estimates and separates weather from some non-weather targets such as insects, birds or debris.
These specialist products are useful, but a standard precipitation layer usually shows processed reflectivity. Its purpose is to make the location and relative intensity of precipitation clear rather than expose every radar measurement.
Why Radar Can Mislead
Radar coverage has gaps and artefacts. A blank area does not always mean dry weather, and a coloured return does not always mean precipitation is reaching the ground.
Distance and beam height
The beam rises higher above the surface as it travels away from the antenna, partly because Earth curves beneath it and partly because the beam bends through the atmosphere. Far from the radar, it may pass above shallow rain, drizzle or snow. The map can therefore miss low-level precipitation near the edge of coverage.
Mountains and other obstructions
Terrain and large structures can block or weaken the beam. Radar networks reduce these gaps by combining several stations, but mountain regions may still have uneven coverage.
Ground clutter and biological targets
Buildings, hills, wind turbines, insects and migrating birds can all return radar energy. Processing removes much of this clutter. What remains may appear as stationary speckles, rings or patches that do not move like surrounding weather.
Evaporation below the beam
Radar can detect precipitation that evaporates or sublimates before reaching the surface. This is often called virga. The map may show a shower while the ground stays dry, especially when the air below the cloud is dry.
Attenuation and unusual propagation
Heavy precipitation can weaken the signal and hide conditions farther from the antenna. Unusual temperature and moisture layers can also bend the beam towards the ground, creating false echoes or extending detection beyond the usual range.
Use an animation to identify returns that persist and move with a weather system. Compare uncertain radar signals with surface observations, the forecast and visibility information.
How Weather Satellites Observe the Atmosphere
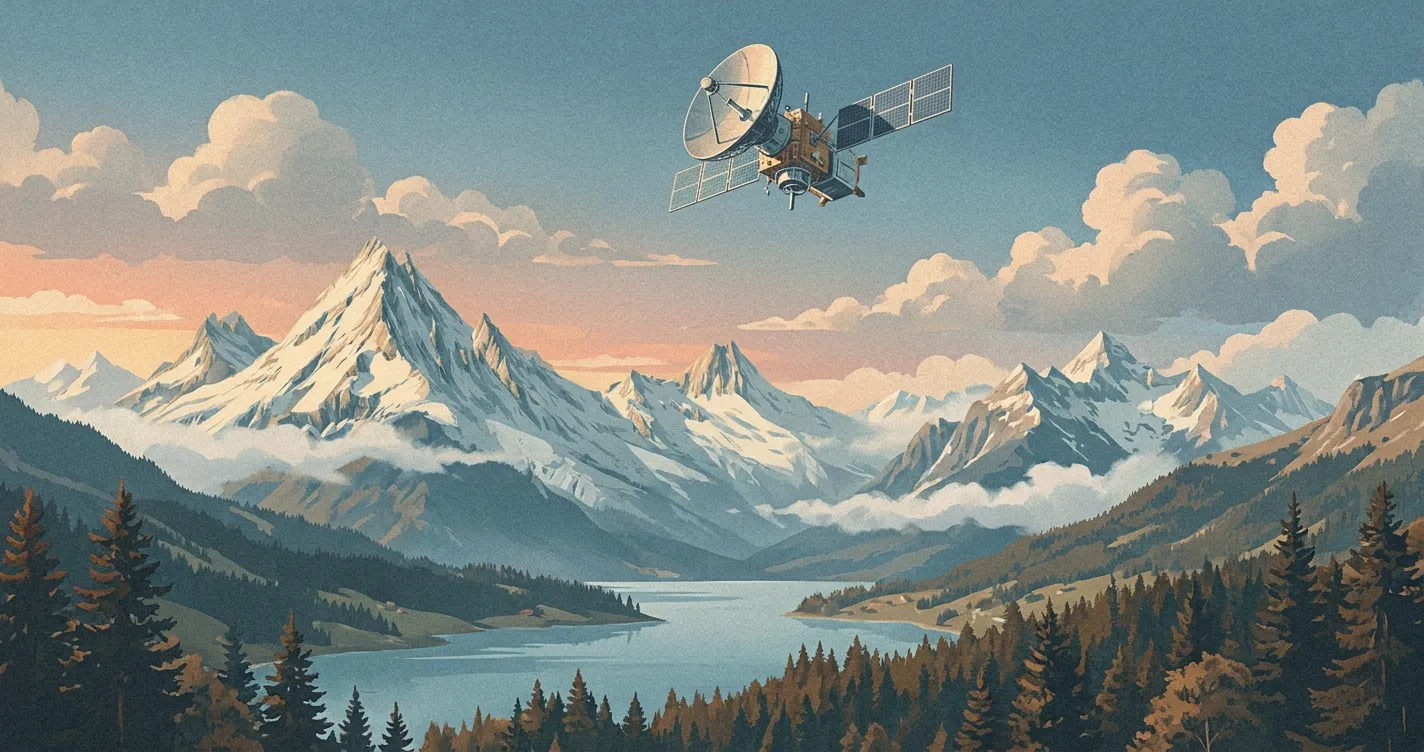
Weather satellites carry radiometers that measure energy in selected wavelength bands. The measurements are converted into images, and colours may be added to make temperature ranges or cloud properties easier to see. A satellite image is therefore a measurement-based visualisation, not an ordinary photograph.
Two broad orbit types provide complementary views:
- Geostationary satellites orbit above the equator at the same angular rate that Earth rotates. They continuously observe the same broad region, which makes them well suited to frequent animations of developing weather.
- Polar-orbiting satellites travel much closer to Earth and pass near the poles. They observe narrower swaths with finer detail and carry instruments that measure temperature, moisture and other atmospheric properties. A given place is observed less continuously.
Weather services combine observations from several satellites to cover much of the planet. Image quality and viewing angle become less favourable near the edge of a geostationary satellite’s view, especially towards high latitudes.
Visible, Infrared and Water Vapour Imagery
Visible imagery
Visible sensors measure reflected sunlight. Thick clouds usually look bright because they reflect plenty of light, while ocean and many land surfaces appear darker. Fine cloud texture, cloud streets, snow cover, smoke and dust can be easier to recognise in a high-resolution visible image.
Visible imagery only works where sunlight is available. Snow and cloud can also look similar in one frame. An animation helps because clouds move and change while snow cover stays fixed to the terrain.
Infrared imagery
Infrared sensors measure emitted thermal radiation, so they work during day and night. The measurement is commonly displayed as a brightness temperature. Colder cloud tops are usually higher, although the exact relationship depends on the atmospheric temperature profile.
Colour-enhanced infrared layers highlight ranges of cloud-top temperature. They are useful for following deep convection and broad cloud systems, but bright or strongly coloured pixels do not tell you whether rain is reaching the surface. Low cloud and fog can also be hard to separate from land when their temperatures are similar.
Water vapour imagery
Water vapour channels respond mainly to moisture and temperature in broad layers of the middle or upper troposphere. They reveal the movement of moist and dry air around troughs, ridges and jet streams, even where no obvious cloud is present.
A dark area does not necessarily mean the air near the ground is dry. The image is weighted towards a layer higher in the atmosphere, and the height represented changes with atmospheric conditions. For surface humidity, use a local observation or humidity and dew point.
Composite and true-colour products
Many modern layers combine several spectral bands into an RGB image. Each product is designed to bring out particular features such as fog, snow, dust, smoke, volcanic ash or cloud phase. The colours are interpretive, so the product legend is part of the image. A layer labelled true colour may still use adjustments that improve contrast or provide a nighttime appearance.
For the meaning of cloud percentages in a forecast, see Cloud Cover Explained.
How to Read a Weather Animation
Start with the layer name, legend and timestamp. Then play several observed frames instead of judging one still image.
- Check whether the frames are observed or projected. A dashed timeline, style change or forecast label may mark the transition to a radar extrapolation.
- Follow the whole pattern. Watch the leading edge, but also note whether showers are forming, weakening or merging. A simple straight-line estimate fails when precipitation changes intensity.
- Allow for gaps. Missing frames, radar boundaries and abrupt seams in a satellite mosaic can create jumps that are not real weather changes.
- Compare layers. Radar shows where precipitation is detected. Infrared or visible imagery shows the cloud system around it. Surface observations tell you what is reaching the ground.
- Zoom out before zooming in. The regional pattern explains whether a shower is isolated, part of a front or embedded in a larger storm.
Radar is most useful for the immediate short term. Its value drops as you project farther ahead because storms can grow, decay and change direction. For later conditions, use the full weather forecast.
Radar Is Not a Safety Warning
A map can help you understand a storm, but it cannot confirm that conditions are safe. Lightning may strike outside the heaviest radar return, flash flooding can continue after rain moves away, and damaging wind or hail may affect an area too small to interpret confidently on a consumer map.
Use official instructions and alerts for hazardous weather. Our guide to thunderstorms and lightning explains how these storms develop and which hazards they can produce.
Use Airpult for Local Context
Airpult's public location pages currently provide local forecasts and observation context, not radar or satellite imagery layers. Use the responsible meteorological service for those images, then compare them with Airpult's local precipitation, cloud cover, visibility and wind forecast.
Explore Airpult to check those local conditions before making a weather-sensitive decision.